Intro
Even though the outbox pattern and observability subjects don’t seem necessarily related, they actually have some points of contact we need to be aware if we want to make the most of them.
This short post will look into where these subjects intersect and a possible approach to getting things working together nicely. Do note that the code accompanying the post is simplified for demo purposes, but you can check it out on [GitHub](https://github.com/joaofbantunes/OutboxPatternMeetsOpenTelemetrySample).
Some understanding of both the transactional outbox pattern, as well as how to implement distributed tracing with OpenTelemetry is required to keep up with this post.
Nice traces, without outbox
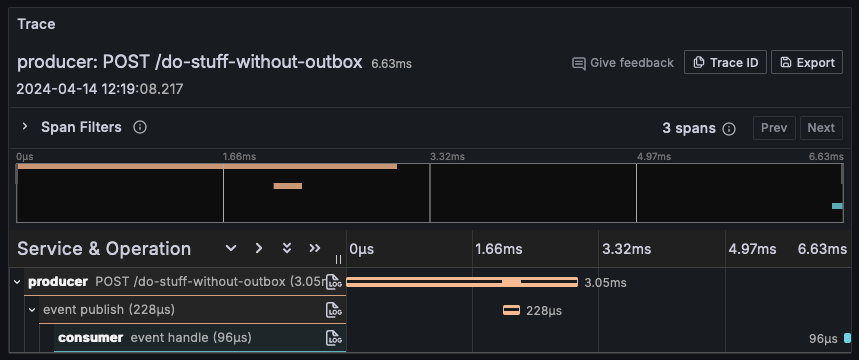
We start by implementing naive event publishing, with no outbox, but with distributed tracing in place. If we directly publish the event from within the scope of the HTTP request, everything ties together neatly, and we get nice and complete traces, like the one below.
If you feel like checking out the [code](https://github.com/joaofbantunes/OutboxPatternMeetsOpenTelemetrySample), the most relevant bits are:
– The HTTP part of the tracing, is available out of the box, implemented by ASP.NET Core, we just need to wire some things up (`AddAspNetCoreInstrumentation` and the like)
– The event publishing part (using RabbitMQ for this demo) wasn’t available out of the box when implementing this demo, so it’s done manually, but it’s available in newer versions of the client library
Enter the outbox, messing things up
So, we have nice tracing, but now we want to increase the application’s resiliency by implementing the transactional outbox pattern.
We start to change the endpoint to write the event to the database, instead of publishing it directly (this would normally use some abstraction, but as you’ll notice if you download the code, I’m doing it directly in the endpoint, to keep things clear in the demo).
Additionally, we create the outbox publisher background service, which polls the outbox to check if there’s something to publish. As we also want to have some visibility into what’s going on with this background service, we add some code to start a trace in each polling iteration.
We run our application, invoke the endpoint and check out the resulting trace:
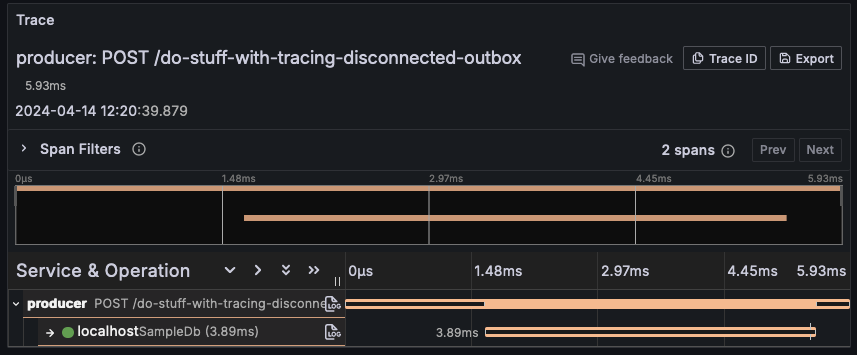
We can immediately notice that now, all the trace shows us is the received POST request, as well as writing the event to the database. There’s no correlation between the HTTP request, the event being published and being consumed.
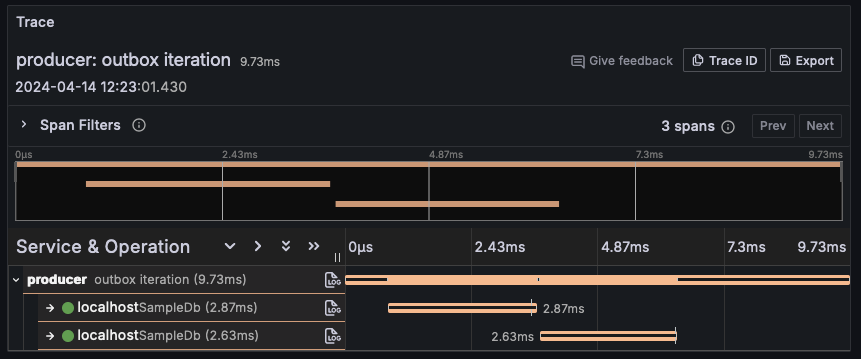
Looking into the outbox iteration trace, we see the following:
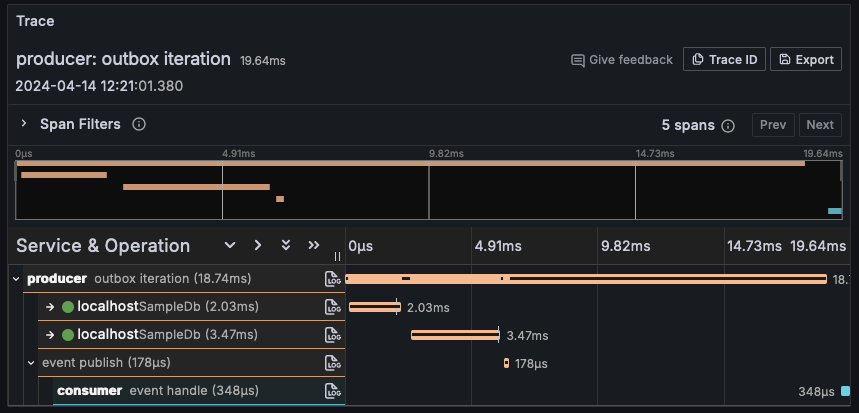
So, given the fact the HTTP request and the outbox iteration execute independently, while the effective event publishing is done in the context of the outbox iteration, introducing the outbox actually broke the nice looking traces we had earlier.
Let’s add some code to get our nice traces back, while maintaining the outbox in place.
Tying everything together
To get everything playing nicely together, the idea is to use the exact same technique that’s used when we want to propagate the tracing information across systems, like it’s done in HTTP requests (built-in to .NET’s HTTP client) or publishing events (which we did manually).
In this case, when storing the event in the outbox, we want to include the current tracing context, so that later, before publishing, we can restore it. In this example, I implemented this by storing the current tracing context in a JSON column of the outbox table.
Extracting the context looks like the following:
```csharp
private record struct ContextEntry(string Key, string Value);

public static string? ExtractTelemetryContextForPersistence()
{
    var activity = Activity.Current;

    if (activity is null) return null;

    var extractedContext = new List<ContextEntry>();

    Propagator.Inject(
        new PropagationContext(activity.Context, Baggage.Current),
        extractedContext,
        InjectEntry);

    return JsonSerializer.Serialize(extractedContext);

    static void InjectEntry(
        List<ContextEntry> context,
        string key,
        string value)
        => context.Add(new(key, value));
}
```
If you took a look at previous posts, you’ll recognize much of this code, in particular the usage of the `Propagator` (of type `TextMapPropagator`), to extract things. When integrating with messaging systems, I included the extracted context in the message headers, in this case, I’m storing everything in a list, to serialize as JSON and include in the outbox entry.
Then, just before publishing the event, we can restore the context like so:
```csharp
public static Activity? StartActivityFromPersistedContext(
  string? telemetryContext)
{
  if (string.IsNullOrWhiteSpace(telemetryContext)
  || !ActivitySource.HasListeners())
  {
    return null;
  }

  var links = Activity.Current is { } currentActivity
      ? new[] { new ActivityLink(currentActivity.Context) }
      : default;

  var deserializedContext = JsonSerializer
    .Deserialize<List<ContextEntry>>(telemetryContext)!;

  var parentContext = ExtractParentContext(deserializedContext);
  Baggage.Current = parentContext.Baggage;

  return ActivitySource.StartActivity(
      "outbox message publish",
      ActivityKind.Internal,
      parentContext.ActivityContext,
      links: links);

  static PropagationContext ExtractParentContext(
    List<ContextEntry> storedContext)
  {
    var parentContext = Propagator.Extract(
      default,
      storedContext,
      ExtractEntry);

      return parentContext;
  }

  static IEnumerable<string> ExtractEntry(
    List<ContextEntry> context,
    string key)
  {
    foreach (var entry in context)
    {
      if (entry.Key == key) yield return entry.Value;
    }
  }
}
```
Again, much of the context restoring code should look familiar, just getting the data from the serialized JSON, instead of some message header.
There’s also some potentially noteworthy tidbit, which isn’t exactly needed, but felt like it could make sense: including a link to the outbox iteration trace in the overall application flow trace. We’ll see in a second why this might be useful.
With all of this in place, our trace now looks like this:
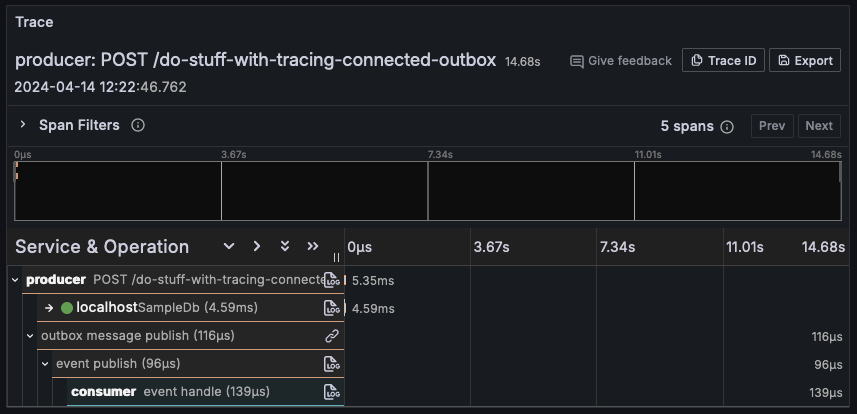
As we can see, we’re back to having our end to end trace, with a couple of extra spans, due to the couple extra things we’re doing: writing the outbox message to the database and publishing from in the scope of the outbox publisher (though we could cut some spans out if we don’t find them useful).
You’ll notice the outbox iteration span doesn’t show here. That’s because, as was the case before, that runs in its own scope, having a dedicated trace of its own. That trace now has less spans included, because we moved them to the overall application flow trace. We can see the smaller outbox iteration trace below.
Some with an attentive eye might have spotted a little link icon (🔗) in the «outbox message publish» span of the overall application flow trace. That relates to the link I mentioned in the code earlier, which references the outbox iteration trace we just looked at. Not sure it’s the most important thing ever, but hey, it’s nice to know we can create this sort of relationship between different spans.
Outro
That’s a wrap for this quick post. Nothing fancy, just a problem I had to solve.
We took a look at how introducing the transactional outbox pattern into a system implementing distributed tracing can have an impact on the quality of the insights gathered, as well as a way to get everything connected again.
I tried to keep the post as brief as possible, so for more details take a look at the [source code](https://github.com/joaofbantunes/OutboxPatternMeetsOpenTelemetrySample), and test things for yourself:
– Use the Docker Compose file to quickly spin up the required dependencies
– Run both the Producer and the Consumer applications
– Make a couple of requests to the Producer API – there’s a `requests.http` file in there with sample requests ready to go – Head to Grafana at `http://localhost:3000` (default user/pass is admin/admin), go to «Explore», select Tempo as the source and take a look at the generated traces